
The Cost of Retention...Varies
Calculating the cost of employee retention is an attempt to quantify a missed opportunity. There are lots of ways to assign dollars to the hard and soft costs around human capital, however it’s a slippery concept to plan for: failing to retain employees. Attention seems to go to the emotional cost, “Were they unhappy? Was it me? What are we going to do now” rather than the financial reality, “$15 grand just walked out the door.”
Identifying the ways to make the cost of retention more real helps business leaders figure out how they could optimize their own organization to capture some lost revenue or improve their employee retention overhead. How do they do that? Data wonks, get excited.
If data makes you sweat, I summarized a TL;DR at the end of each section. Like for this article, the simple takeaway:
Employee retention costs more money than anyone wants.

$5,688 - $12,881
Hotel industry circa 2000
The biggest takeaway from this study is that the training and ramp-up period, aka “Productivity costs”, comprise about half of the total cost of losing an employee (page 19). The authors of the study divided costs into two buckets, hard costs (such as recruitment, selection, hiring) that can easily be tied to dollars, and soft costs (such as training and the inefficiency of a new employee). Take a look at this graph that analyzes the soft costs of training front office associates in the hotel industry in 2000:
![Hinkin, T. R., & Tracey, J. B. (2000). The cost of turnover: Putting a price on the learning curve [Electronic version]. The Cornell Hotel and Restaurant Administration Quarterly, 41(3), 14-21. Retrieved 11/5/2019, from Cornell University, Schoo…](https://images.squarespace-cdn.com/content/v1/5d94e75396c0cd7237eaf8ab/1572979025910-1YVCBARUAECFXRLYDAWH/Turnover+cost+percentages+in+the+hotel+industry)
Hinkin, T. R., & Tracey, J. B. (2000). The cost of turnover: Putting a price on the learning curve [Electronic version]. The Cornell Hotel and Restaurant Administration Quarterly, 41(3), 14-21. Retrieved 11/5/2019, from Cornell University, School of Hospitality Administration site: http://scholarship.sha.cornell.edu/articles/445/. Page 20
The way to read those numbers is
Learning Curve %: On a scale from 1 to 100, how proficient is a new employee relative to someone who is competent at their task?
Learning Curve days: How long does it take the average new employee to reach an acceptable level of competence?
Peer disruption %: A calculated percentage of the decrease in an experienced worker’s productivity by a new employee who needed help or training.
Peer disruption days: How many days were impacted by the experienced employee’s reduced productivity (basically how many days they were spending some time coaching a new employee).
Supervisor Disruption was calculated the same way as Peer Disruption except now we’re impacting the new employee’s supervisor.
Cost of turnover takes all those costs and uses the yearly salary/wage as the dependent variable.
Here’s an easier to understand story using Hotel D from the graph above:
Jack is a new hotel employee in New York City as a front office associate. His salary is $100,000 because easy math is good math.
When he first starts, he’s about 58% as competent as someone who has been doing this job for the past year. He gets three tasks done in the same time that an experienced employee can complete five tasks.
It takes Jack 80 days to ramp up to be as competent as a tenured employee.
During that ramp up time, Jack bothers Jill, an experience employee, with enough questions that she’s 23% less productive.
Jack is impacting Jill’s productivity for about 63 days as she trains him.
Jack is also impacting his boss, Big Joe, with all of his questions. Jack decreases Big Joe’s productivity by 27% over 16 days.
At the end of the year, Jack decides that the hotel industry is not for him and he leaves. Since he was making $100K, the hotel has now lost $29K that was invested in Jack.
The study acknowledges that these are conservative estimates. Ignoring the value generated by a front-office associate and simply focusing on the hard and soft costs of bringing an employee to a level of productivity is a great bedrock metric that avoids the wishy-washy “how much hypothetical value did they generate”.
TL;DR- Time is money and a new person sucks up time from colleagues and supervisors while they ramp up.

$1,300,000 increase in net revenue
Employee Lifetime Value circa 2016
Maia Josebachvili penned a compelling and well-illustrated rundown of Employee Lifetime Value, or ELTV. The critical assumption here is that there is value captured over time by an employee that increases and decreases based on how effectively they work. Their effectiveness is a direct result of organizational culture and policy. If you follow her train of thought regarding a salesperson, you get to this pretty picture:
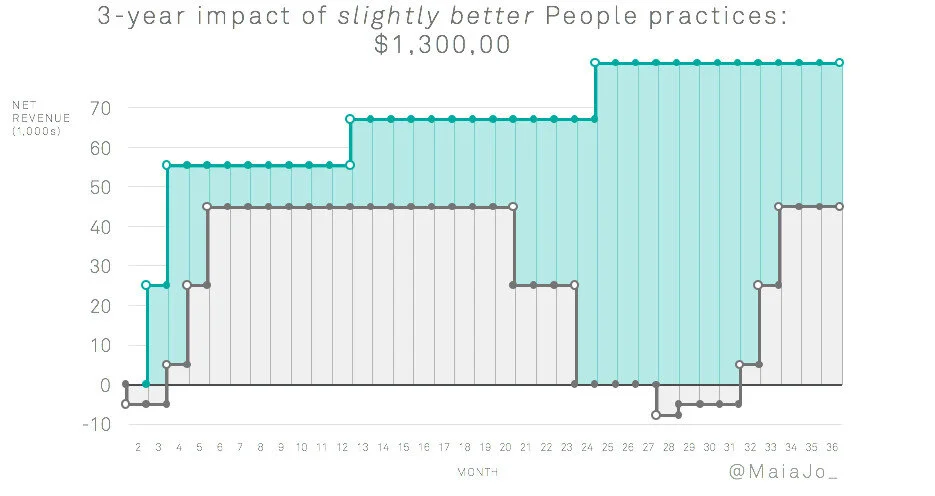
The area captured under the black line illustrates a typical salesperson whereas the teal line and area illustrates a salesperson in a slightly more efficient and productive culture.
A better onboarding program reduces a 6 month typical ramp up period to a 4 month ramp up period.
A better hiring process brings in talent that can perform 20% better than a typical hire.
A better culture and management environment improves an employee’s performance by 20% in a year.
Great culture and management practices can add a year to employee tenure while the other employee becomes disengaged and leaves in the second year.
Assuming it takes 4 months to backfill, the salesperson at the better organization is still capturing high-value revenue while the other organization is starting from the beginning.
Add this all up: $1,300,000 of a difference in net revenue between the two salespeople. Difference. Not total revenue for the better rep at the better organization. Difference.
The assumption that an organization’s policies and environment can influence the lifetime value for an employee seems reasonable. It would behoove organizations to do anything they can do to move the needle on hiring, onboarding, culture, and management; even a small improvement could translate into huge potential value. You could dither on whether a single improvement nets a 2% improvement or 20% improvement, but the compounding effects are stratospheric.
TL;DR- Even small improvements for an organization can vastly increase the value of an employee’s impact over time.

$4,425 walking off 26% of the time
HR Professional Organization circa 2017
The Society for Human Resource Professionals (SHRM) does a regular Human Capital Benchmarking Report and the Talent Acquisition section has some juicy statistics from surveyed companies:
Page 9: The average cost-per-hire is $4,425. If it’s an executive, add another $10K on top of that.
Page 10: 3% of surveyed companies have a “stress interview” for executives and middle managers. That sounds painful.
Page 15: It takes on average 36 days to fill a role. That’s over a month.
Page 17: 26% of new hires leave within their first year, on average.
Let’s tease this out a bit more. Over a quarter of new hires, each acquired at $4.4k, will leave within the year. Now, pulling from page five of another one of their benchmarks on Human Capital, we see that average revenue per FTE is $351,262, giving average organizations a 12.1% profit margin. Let’s do scary math:
You hire four employees costing $4,425 per hire. You’ve outlaid $17,700.
One will leave within the year.
You’ll have a month of that role staying vacant while you backfill, based on the average time to hire.
Your lost employee should have earned $351K for the organization, assuming they were fully ramped up.
For the month that the seat sat empty, assuming the employee was fully ramped up, the company lost $29.3K of expected revenue, of which 12.1% was profit that could have been reinvested in the business.
That profit was $3,500 of bonuses, capital investments, or milkshakes that you’ve lost out on.
Math is fun. There’s a lot of scrumptious data in those benchmarking reports but the biggest takeaway is that turnover is expected and should be budgeted per employee. Managing the risks around employee performance require some level of hedging and using benchmarks is a great starting point to be prepared for those unexpected costs. It would be foolhardy to assume that your organization will hit growth projections if cost of turnover isn’t a factor in your forecasting.
TL;DR: Risk of turnover can be calculated, forecasted, and hedged, so don’t be surprised when it actually happens.

Let’s review:
Ramping up new hires impact more than a single new person.
Small organizational improvements magnify an employee’s lifetime impact.
Risk of turnover can and should be planned for during budget season.
These are all things that a business can act on. Choosing which levers to push that reduce overall cost and increase overall value can be tricky because you’re working with irrational beings (i.e. humans), but there are a lot of best practices out there and experts who have done this before. Like Learn to Scale. We get that culture and processes impact the bottom line and know how to drive to the outcomes a business wants to see. Too often do HR professionals focus on the employee experience as an end unto itself; Learn to Scale knows that employee experience is a means to an end, such as improved lifetime value or reduced turnover rates.
With the dollars we’ve been talking about, a free chat is the best price in town.